
User interface
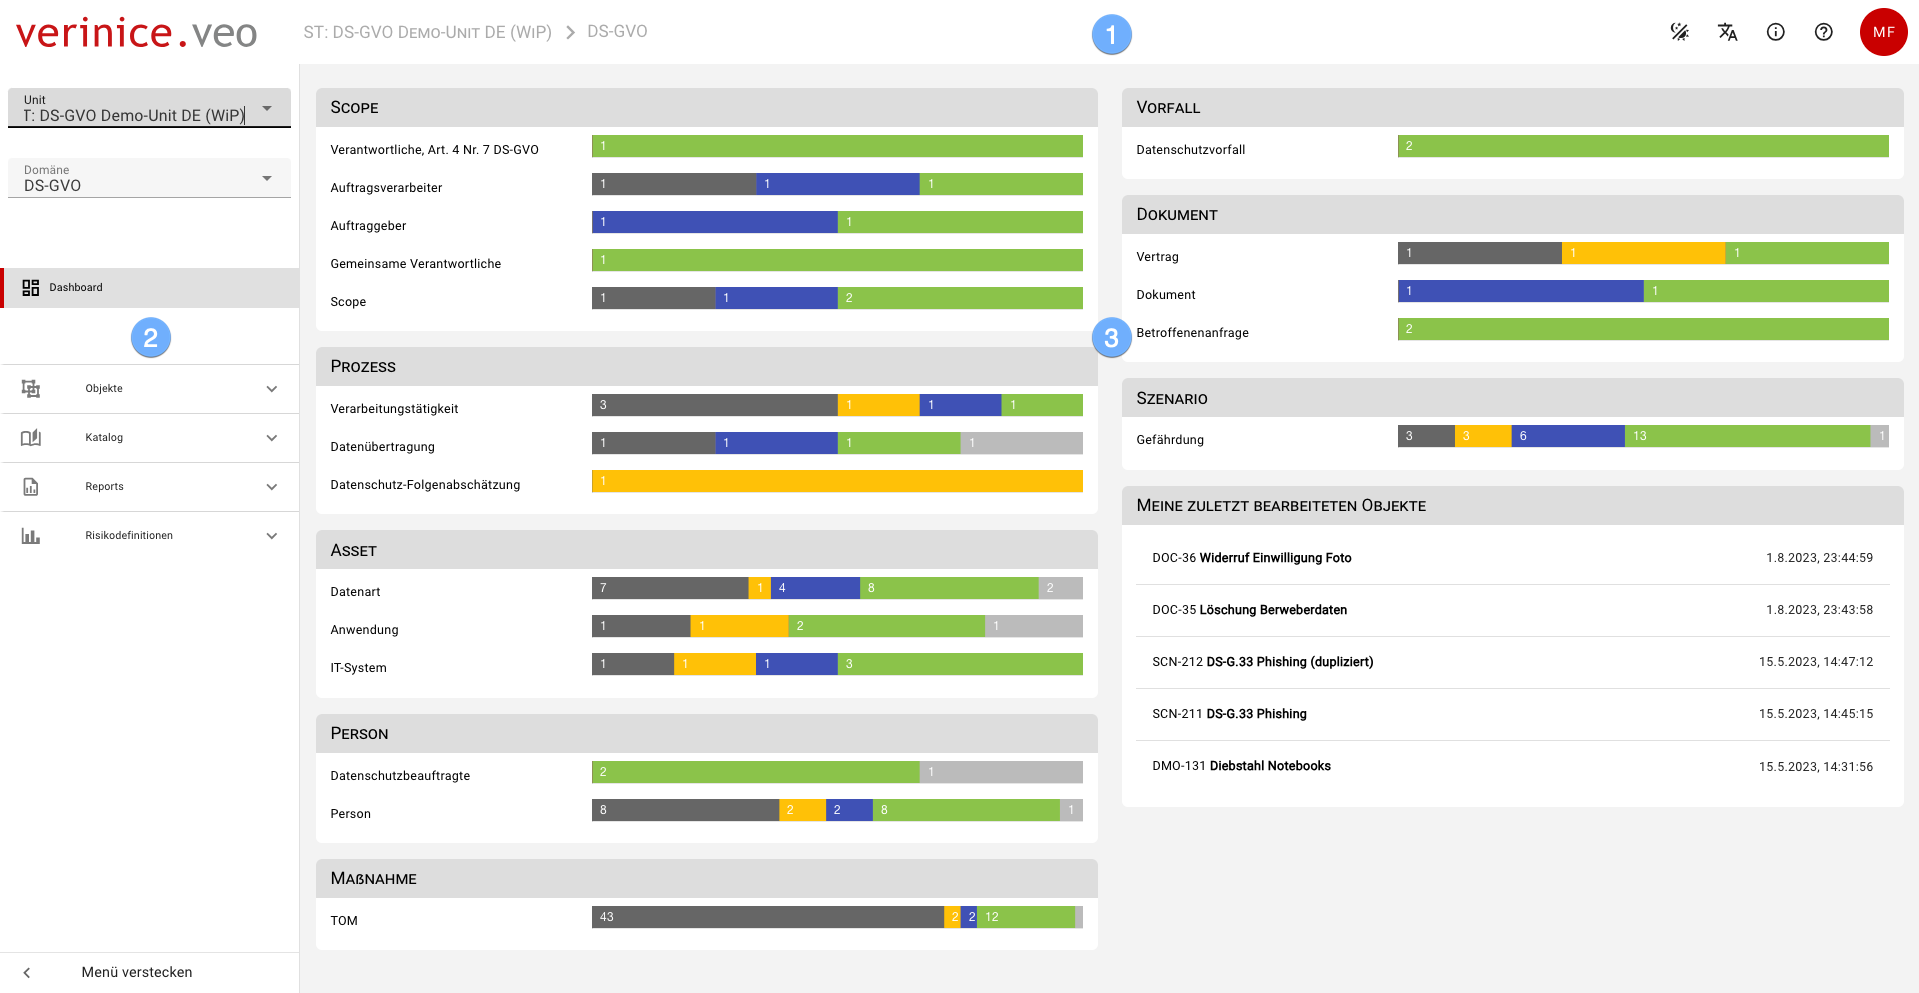 The user interface consists of three areas:
the [application bar](#application bar) provides overarching functions for operation.
use the menu to navigate through all content.
the workspace provides additional views, such as the dashboard.
Application bar
The application bar provides general functions for operation: 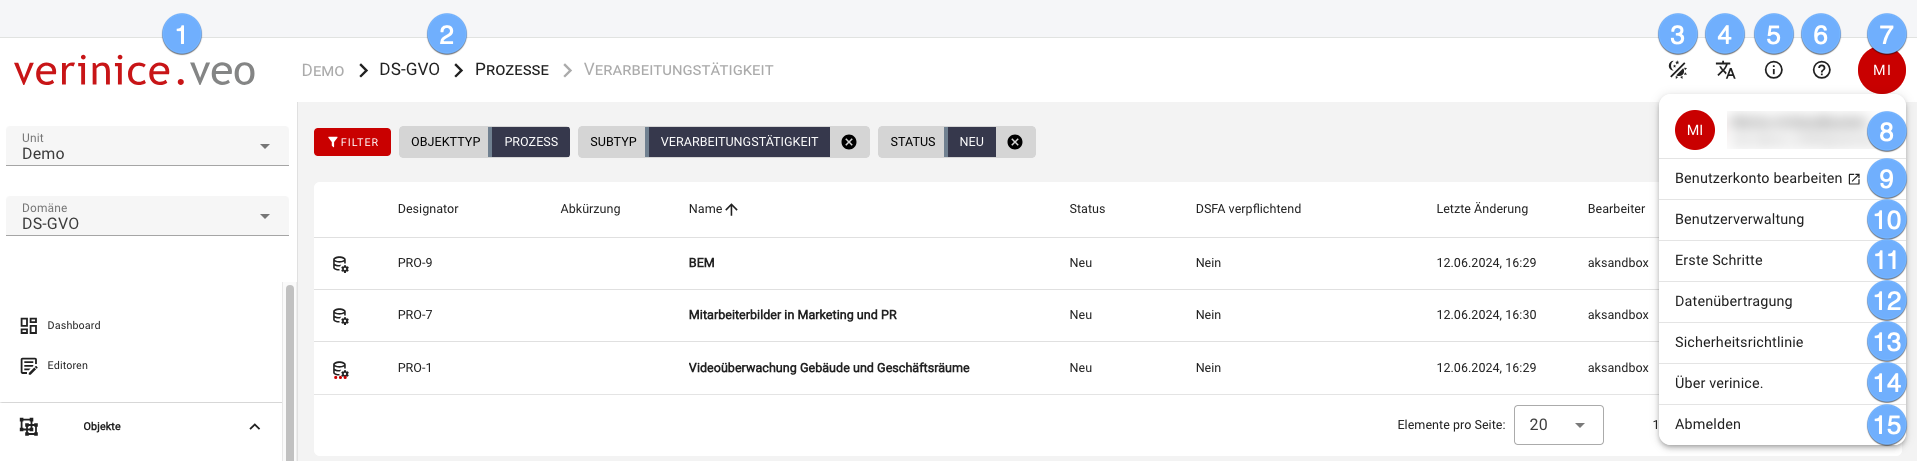
- you can access the unit management at any time via the logo.
- use the Breadcrumb to navigate directly to all listed objects.
- switch between light/dark mode.
- use the language switcher to switch between German and English.
- the Context help provides you with tutorials for the current page.
- the Documentation is opened in a new tab.
- use the Account button to access further settings:
- user name and e-mail of the person logged in are displayed.
- Edit user account opens a new browser tab in which you can, for example, change the password or set up 2-factor authentication.
- as main user you can manage additional users if this is provided for in your plan.
- in this section, you can call up the First steps page that you called up when you first logged in.
- in the Data transfer section, you can download your data.
- in our security policy we describe how to deal with vulnerabilities. 1 About verinice opens a dialog with more detailed information
- end the active session via Logout.
Menu
Use the menu to navigate conveniently through verinice: 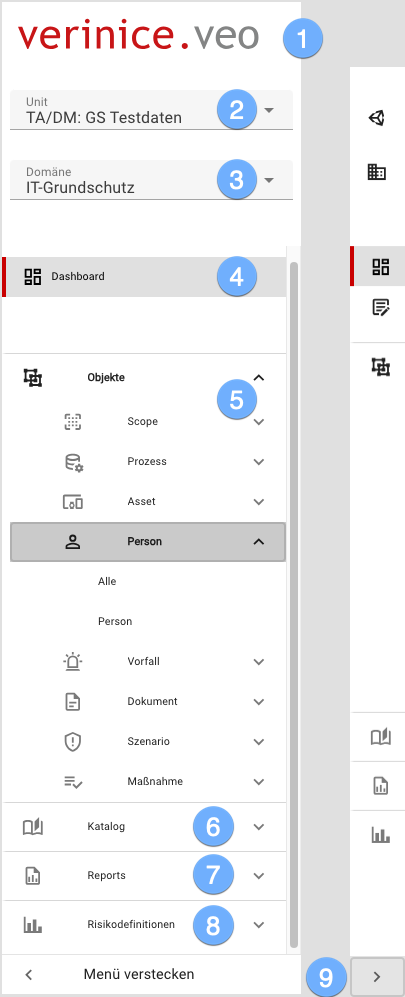
use the logo to access the unit management at any time to create or edit units.
use the unit selector to switch directly to another unit.
use the domain selector to switch to another domain.
the Dashboard provides an overview of all objects and their status (life cycle) and allows you to navigate to all objects.
optionally navigate to all existing objects in the Objects area.
- Catalogs provide you with objects such as TOM or elementary hazards for use in your unit.
create Reports using the Report templates.
in the Risk definitions section, the risk matrix is displayed graphically.
use Hide menu to reduce the navigation to icons, click on one of the icons to display the menu again.
Dashboard
All objects and their status (life cycle) are displayed on the dashboard; click to navigate directly to the respective objects: 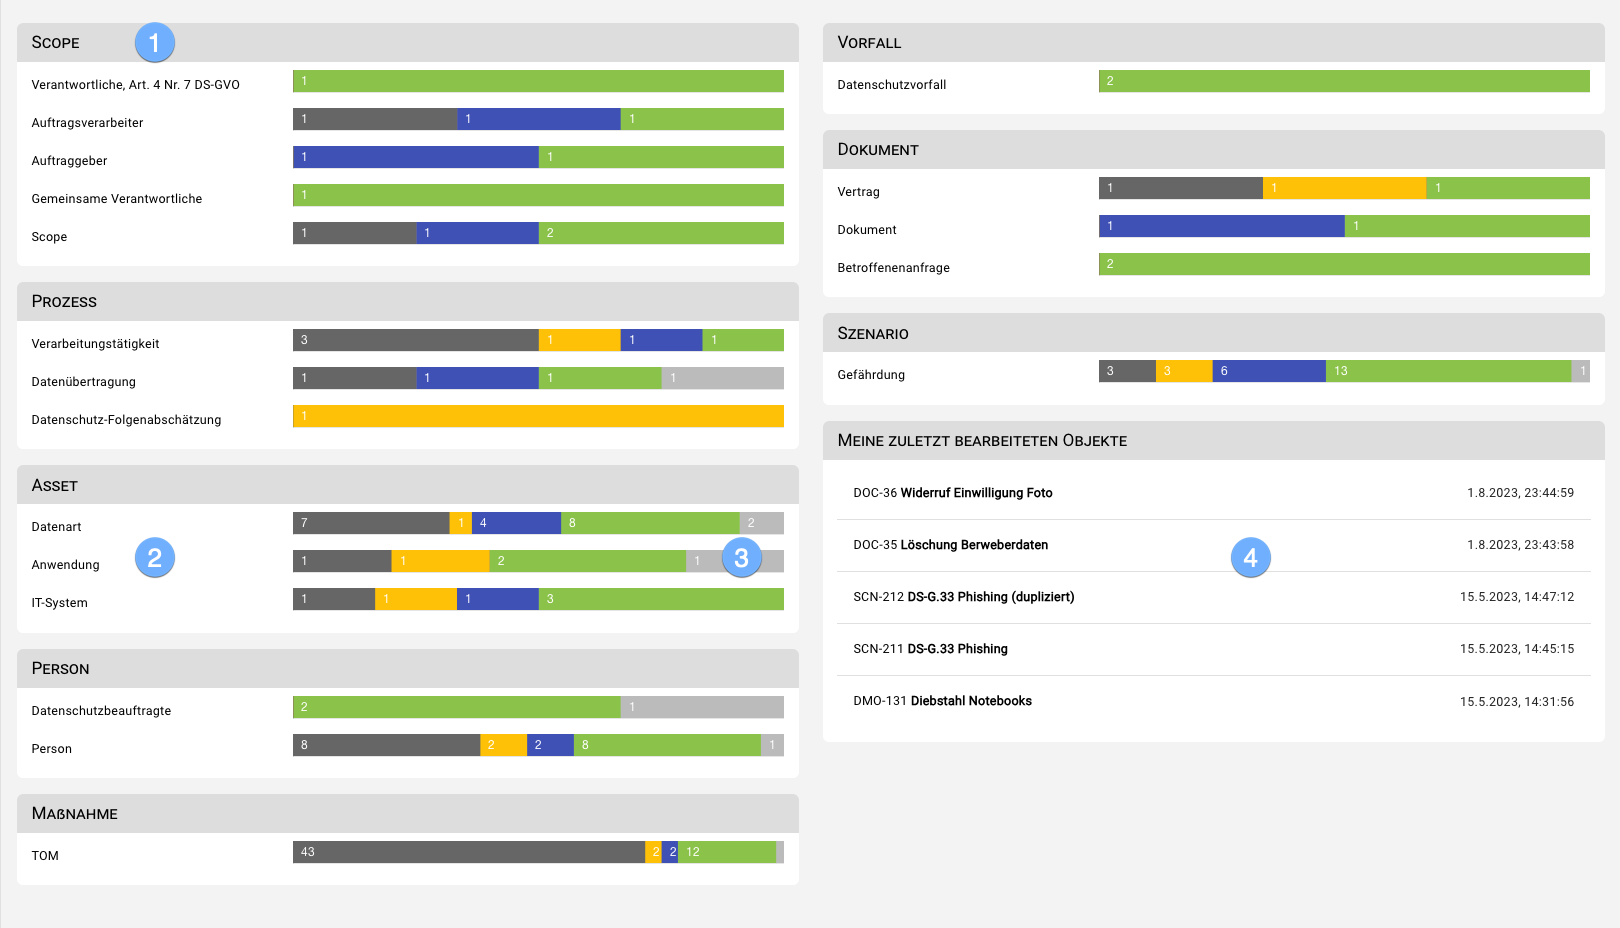
- the objects are grouped according to the object types (scopes, processes, assets, people, controls, incidents, documents and scenarios).
- the object types are also grouped according to the available subtypes.
- the Status (life cycle) are color-coded:
- Dark gray = New
- Yellow = In progress
- Blue = Under review
- Green = Released
- Light gray = Archived
- in the My last edited objects section, you can call them up directly for further editing by clicking on them.